
Sunday, October 12 marked the third anniversary of this bull market. Three years ago, the S&P 500 closed at 3,577 as investors feared inflation would become entrenched after wholesale prices unexpectedly accelerated. After a sharp sell-off that morning, stocks rallied and closed nicely higher that day. A rally on bad news, in hindsight, was a sign of a major inflection point. Fast forward three years, and this bull market is still going strong. But will it continue? With all the talk about a stock market “bubble” (not our characterization) driven by the market’s enthusiasm for stocks riding the artificial intelligence (AI) wave, you may be surprised to know that bull markets lasting three years tend to keep going for a while. We expect that historical pattern to play out again this time, though past performance does not guarantee future results.
How Does This Bull Market Compare to Prior Bulls?
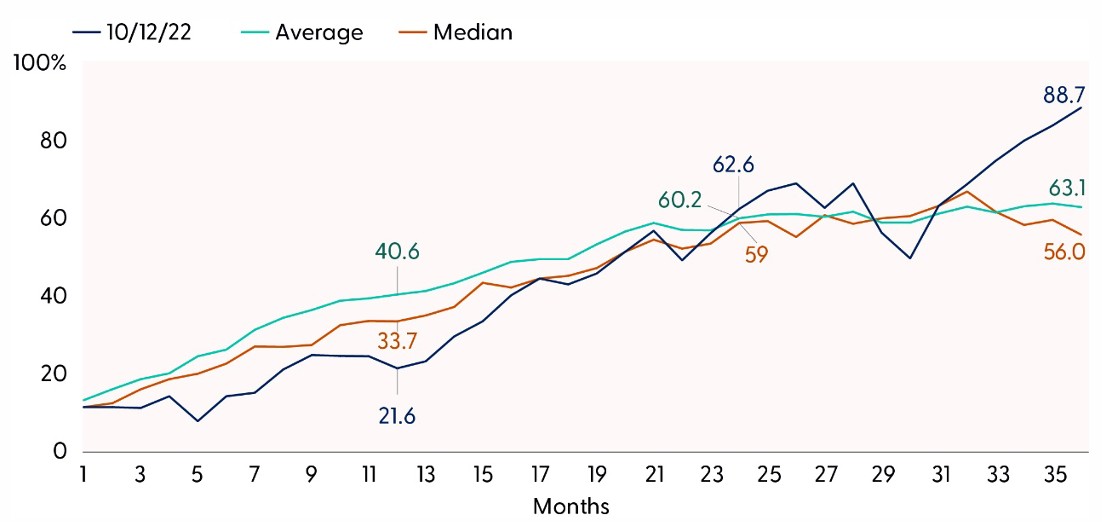
Year three of this bull market was a strong one. After a bit of a slow start — the S&P 500 rose 21.4% during the first year of this bull compared with the average first-year gain near 40% — year two was a catch-up year with a 32.2% gain vs. a second-year average of 12.4%. Then in year three, a year that had produced an average gain of only 5.2% historically, the S&P 500 rallied 16.1% (through October 8, 2025, before Friday’s sell-off). As noted in the “After a Strong Third Year, This Bull is Ahead of Schedule” chart, the nearly 89% gain in the S&P 500 since this bull market began on October 12, 2022 (excluding dividends), is well ahead of the average and median three-year advances for all bull markets since 1950.
After a Strong Third Year, This Bull is Ahead of Schedule
Three-year performance progression of S&P 500 bull markets since 1950 (%)
Source: LPL Research, Bloomberg, 10/09/25
Disclosures: All indexes are unmanaged and cannot be invested in directly. Past performance is no guarantee of future results.
The current bull market progression is based on S&P 500 price performance from 10/12/22 to 10/08/25. All bull markets since 1950 are included.
Bull Market Drivers
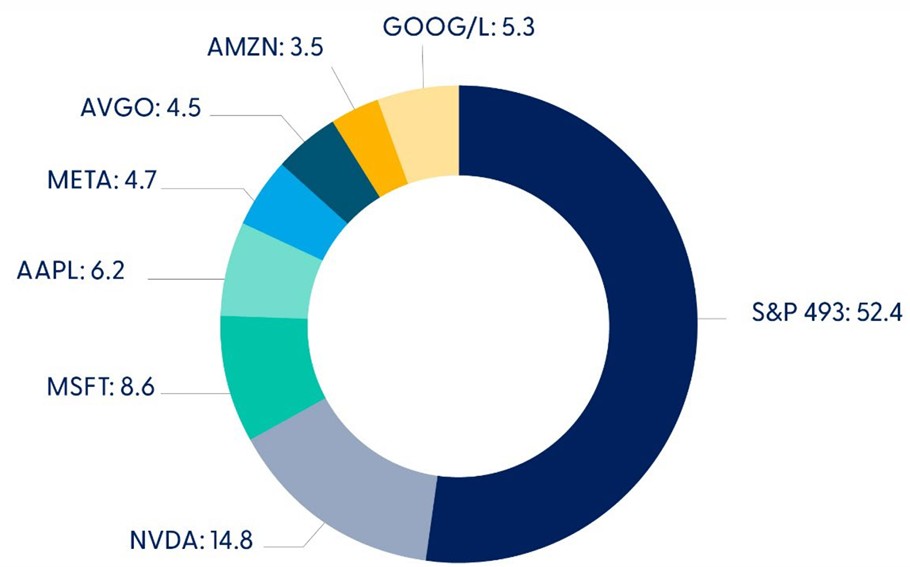
One obvious driver of this bull market is the strength in technology stocks and the AI revolution. ChatGPT was first released in November 2022, just one month after this bull market began. AI isn’t the only driver of gains for mega cap technology, but it’s a big one. As highlighted in the “Seven Technology Stocks Have Driven Nearly Half of this Bull Market’s Advance” chart, roughly half of this S&P 500 bull has been driven by just seven stocks: Amazon (AMZN), Alphabet (GOOG/L), Apple (AAPL), Broadcom (AVGO), Meta (META), Microsoft (MSFT), and NVIDIA (NVDA). That tells us that if these stocks stop working, the “493” will have to step up and carry more of the load to keep this bull market going.
Seven Technology Stocks Have Driven Nearly Half of This Bull Market’s Advance
Contributions to total return of the S&P 500 since the bear market low on October 12, 2022 (%)
Source: LPL Research, Bloomberg, 10/09/25
Disclosures: Indexes are unmanaged and cannot be invested in directly. Past performance is no guarantee of future results.
Stocks shown: Amazon (AMZN), Alphabet (GOOG/L), Apple (AAPL), Broadcom (AVGO), Meta (META), Microsoft (MSFT), and NVIDIA (NVDA).
The macroeconomic backdrop has also been supportive and kept this bull market going. Easing inflation pressures in the fall of 2022, after the 9.1% Consumer Price Index (CPI) reading for June 2022 (reported in July 2022), helped stocks carve out that low. That paved the way for the end of the Federal Reserve’s (Fed) rate-hiking cycle in July 2023, lower market interest rates, and eventually Fed rate cuts.
Where Do Stocks Go From Here?
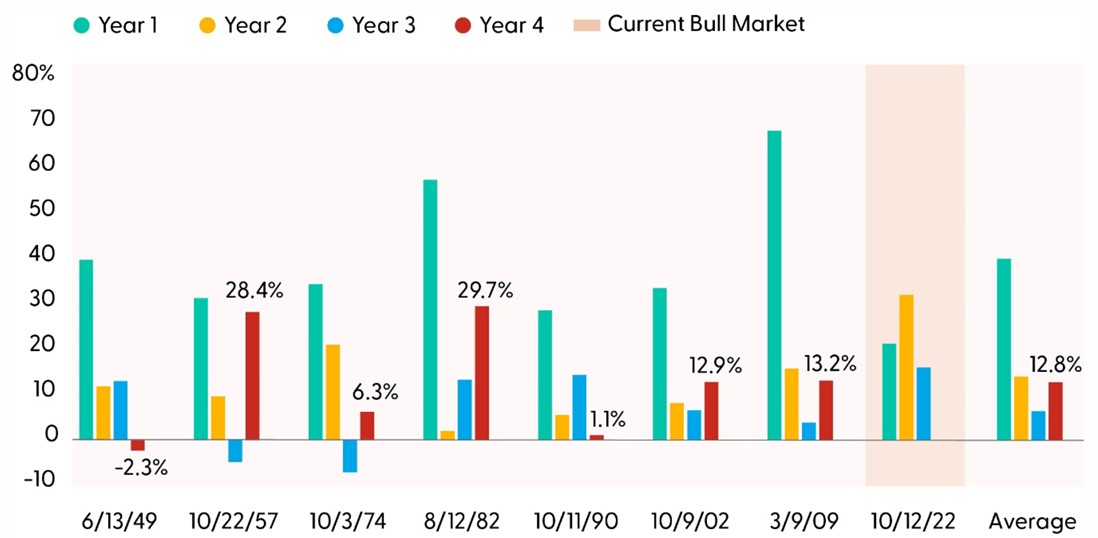
Bull markets that made it to year four have tended to perform very well during that year. As shown in the “History Suggests Year Four for This Bull Market Could Be Another Good One” chart, for the seven bull markets since 1950 that lasted at least four years, the S&P 500 has, on average, gained 12.8% during the fourth year. That’s quite a bit better than the year three average of around 5% — though this bull market has enjoyed an unusually strong year three as discussed above. Six of the seven mature bull markets had positive year fours, with stocks falling during the fourth year of the first bull market after WWII that began in June 1949. Six straight positive year fours bode well for the one just underway, though past performance does not guarantee future results.
So, what are the keys to this bull market lasting another year? First, we need economic growth. Recessions kill bull markets, and thankfully, we don’t see one on the horizon. The Fed can also kill a bull market. Rate hikes to combat inflation ended the first bull market after the pandemic beginning in March 2020, even though there was technically no recession in 2022 when that short bull market ended. The Fed is in the middle of a rate-cutting cycle and inflation appears to be under control despite increased tariffs, likely eliminating that as a potential bull market killer in the next 12 months. Contained inflation and an accommodative Fed reduce the chances that long-term interest rates surge, another key risk given the rising cost to service the U.S. government’s huge and growing debt load.
History Suggests Year Four for This Bull Market Could Be Another Good One
Annual S&P 500 bull market performance by year (only bull markets lasting over four years are shown, 1950 present, %)
Source: LPL Research, Bloomberg, 10/09/25
Only S&P 500 bull markets that made it through a fourth year are shown, in addition to the current bull market.
Disclosures: Indexes are unmanaged and cannot be invested in directly. Past performance is no guarantee of future results.
This Bull Market May Still Have Legs
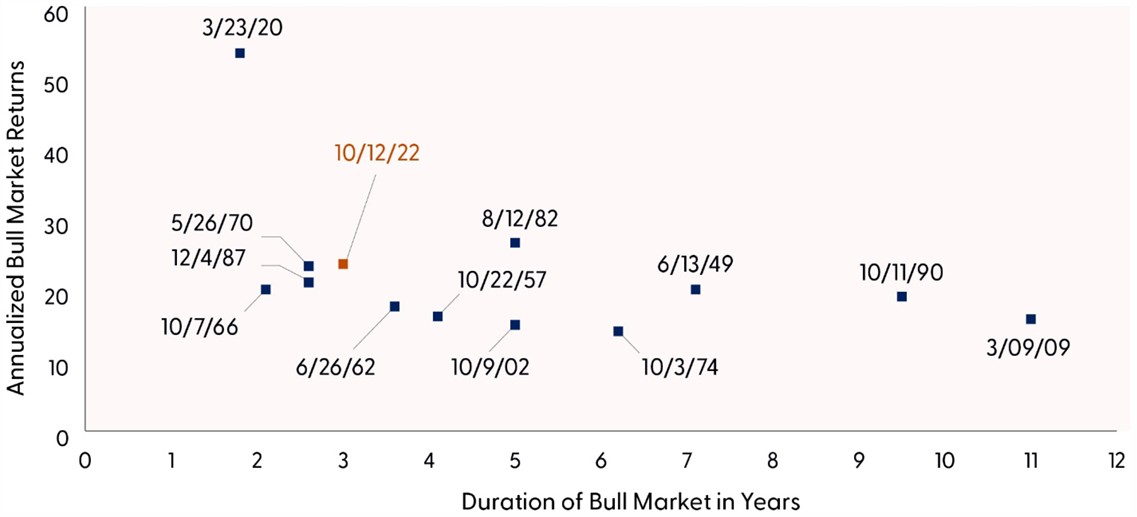
A look back at the history of bull markets is instructive in gauging how much longer this bull might run and what potential catalysts could spark the next bear market. As shown in the “This Bull Market is Not an Outlier in Terms of Age or Returns” chart, most bull markets go longer than three years. They last about five years on average, but the 1990 and 2009 bulls lasted about twice that long. So, this bull market is not old; in fact, it is far from it.
It’s also interesting that the 23% annualized gain for the S&P 500 during this bull market is not that much better than the median (19.5%) or the average (21.8%), with the latter statistic inflated by the post-pandemic bull market that began in March 2020 and produced a 53% annualized gain during its short life. So, while this bull market has enjoyed a strong three years, history suggests it probably has more room to run.
This Bull Market Is Not an Outlier in Terms of Age or Returns
History of bull markets: duration (years) and annualized price performance (%)
Source: LPL Research, Bloomberg, 10/09/25
Disclosures: Indexes are unmanaged and cannot be invested in directly. Past performance is no guarantee of future results.
Conclusion
Now entering its fourth year, this bull market has been solid, with gains nicely ahead of average historical three year bull market returns, largely on strength in mega-cap technology stocks riding the AI wave. History suggests that bull markets reaching a fourth year tend to perform well, with six of the last seven occurrences delivering positive returns in year four. History also tells us that bull markets that last three years usually last five years or more. While past performance is no guarantee of future results, the combination of resilient economic growth, forthcoming fiscal stimulus, a dovish Fed, and strong corporate earnings — especially in tech — suggests this bull still has legs and that we’ll probably be celebrating a fourth anniversary next year at this time.
As always, investors should remain mindful of risks, including geopolitical tensions and potential policy shifts (such as sharply higher China tariffs, as President Trump just threatened), sticky inflation, a slowing labor market, and the need for broader market leadership beyond the Magnificent Seven.
Asset Allocation Insights
LPL’s Strategic and Tactical Asset Allocation Committee (STAAC) maintains its tactical neutral stance on equities. Investors may be well served by bracing for occasional bouts of volatility given how much optimism is reflected in stock valuations, but fundamentals remain broadly supportive. STAAC’s regional preferences across the U.S., developed international, and emerging markets (EM) are aligned with benchmarks. The Committee still favors growth over value, large caps over small caps, and the communication services and financials sectors.
Within fixed income, the STAAC holds a neutral weight in core bonds, with a slight preference for mortgage-backed securities (MBS) over investment-grade corporates. The Committee believes the risk-reward for core bond sectors (U.S. Treasury, agency MBS, investment-grade corporates) is more attractive than plus sectors. The Committee does not believe adding duration (interest rate sensitivity) at current levels is attractive and remains neutral relative to benchmarks.
Important Disclosures
This material is for general information only and is not intended to provide specific advice or recommendations for any individual. There is no assurance that the views or strategies discussed are suitable for all investors or will yield positive outcomes. Investing involves risks including possible loss of principal. Any economic forecasts set forth may not develop as predicted and are subject to change.
References to markets, asset classes, and sectors are generally regarding the corresponding market index. Indexes are unmanaged statistical composites and cannot be invested into directly. Index performance is not indicative of the performance of any investment and do not reflect fees, expenses, or sales charges. All performance referenced is historical and is no guarantee of future results.
Any company names noted herein are for educational purposes only and not an indication of trading intent or a solicitation of their products or services. LPL Financial doesn’t provide research on individual equities.
All information is believed to be from reliable sources; however, LPL Financial makes no representation as to its completeness or accuracy.
All investing involves risk, including possible loss of principal.
US Treasuries may be considered “safe haven” investments but do carry some degree of risk including interest rate, credit, and market risk. Bonds are subject to market and interest rate risk if sold prior to maturity. Bond values will decline as interest rates rise and bonds are subject to availability and change in price.
The Standard & Poor’s 500 Index (S&P500) is a capitalization-weighted index of 500 stocks designed to measure performance of the broad domestic economy through changes in the aggregate market value of 500 stocks representing all major industries.
The PE ratio (price-to-earnings ratio) is a measure of the price paid for a share relative to the annual net income or profit earned by the firm per share. It is a financial ratio used for valuation: a higher PE ratio means that investors are paying more for each unit of net income, so the stock is more expensive compared to one with lower PE ratio.
Earnings per share (EPS) is the portion of a company’s profit allocated to each outstanding share of common stock. EPS serves as an indicator of a company’s profitability. Earnings per share is generally considered to be the single most important variable in determining a share’s price. It is also a major component used to calculate the price-to-earnings valuation ratio.
All index data from FactSet or Bloomberg.
This research material has been prepared by LPL Financial LLC.
Not Insured by FDIC/NCUA or Any Other Government Agency | Not Bank/Credit Union Guaranteed | Not Bank/Credit Union Deposits or Obligations | May Lose Value
For public use.
Member FINRA/SIPC.
RES-0006007-0925 Tracking #809885 | #809887 (Exp. 10/26)