Last week was a pivotal one for markets, with the S&P 500 coming off a 3% weekly decline the week before. In terms of economic data, we got our first look at first quarter gross domestic product (GDP) as well as the March reading of the Federal Reserve’s (Fed) favorite inflation measure — the core PCE deflator. If that wasn’t enough to digest, over 150 S&P 500 companies reported quarterly earnings last week, including the first batch of big tech names. Stocks passed the test, with the S&P 500 up 2.7% for the week, recapturing most of the prior week’s losses despite a mixed GDP report and a double digit decline in shares of social media giant Meta (META) on April 25, after its results. Here we recap the week’s events and check in on sentiment.
GDP LOOKED BETTER AFTER PEELING BACK THE ONION
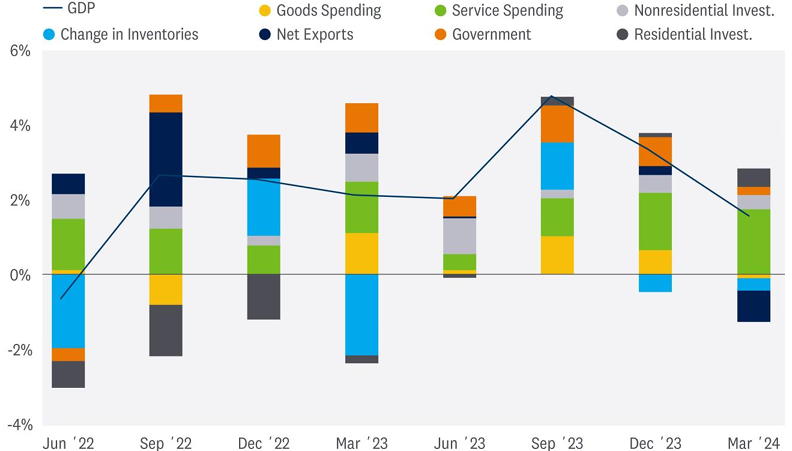
The overall domestic economy grew 1.6% annualized in the first quarter, dragged down by inventories and trade. Consumer spending continued to hold up well with an annualized increase for the quarter of 2.5%, though that was shy of expectations near 3%. Consumers did pull back on goods purchases and focused on the demand for services in an economy still recovering from the pandemic shock.
CONTRIBUTIONS TO U.S. GDP GROWTH

Source: LPL Research, U.S. Bureau of Economic Analysis, 04/25/24
Capital investment rose at a solid 2.9% annualized pace, while residential investment contributed to growth as demand for housing was strong. Construction activity was robust as builders worked to offset the low inventory of homes available for sale amid years of underbuilding.
Looking forward, the economy will likely decelerate further in the quarters ahead as consumers will end their spending splurges if real disposable incomes wither and savings wane. We should expect inflation to ease throughout this year as aggregate demand slows, although the path to the Fed’s 2% target still seems to be a long way off.
A bit less growth to take some of the upward pressure off inflation would have been a positive development at this presumed late stage of the business cycle, increasing the chances of a soft landing. But with the strength under the surface, those looking for slower growth didn’t get it.
STICKY INFLATION
Those looking for evidence of cooling inflation in last week’s GDP report also came away disappointed, as the core Personal Consumption Expenditures (PCE) price index, which excludes food and energy, rose 3.7% annualized, up from 2% in the fourth quarter. This is the Fed’s preferred inflation measure.
Zooming in on March, though, the core PCE inflation reading was more reassuring, with the
annual reading holding steady at 2.8%, the same pace as February. Friday’s 1% rally was mostly on earnings (more on that below), but in-line March inflation data helped.
Before we get to the Fed, a few more observations from last week’s data:
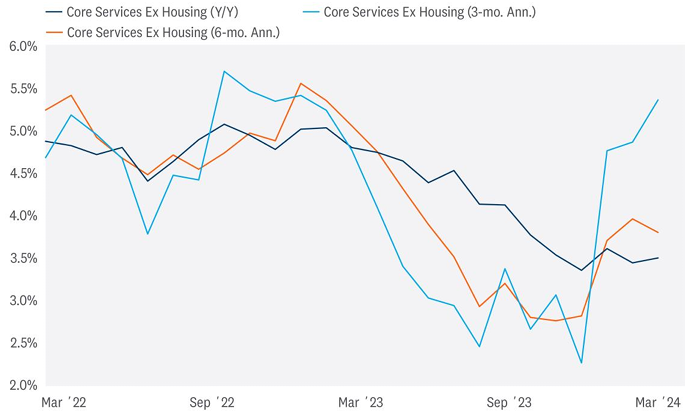
- Inflation for services and goods are on two very different glide paths. Annual services inflation was 4% in March, but goods inflation was roughly flat. We will continue to watch services inflation closely.

Source: LPL Research, Bureau of Economic Analysis, 04/26/24 - Real disposable personal income rose 0.2% in March, which gave consumers some support amid high prices. But the savings rate for March fell to 3.2%, the lowest since late 2022, as consumers are likely feeling the pinch of sticky inflation.
- If the economy slows and inflation lingers, the stagflation debate will likely resurface, potentially instigating some volatility in markets.
- Bond investors may have to wait a bit longer for a rally. Long-term Treasury yields may stay above the LPL Research year-end target range of 3.75% to 4.25% longer than we had previously anticipated, which could constrain valuations for equities already at 20 times forward earnings.
- Finally, the U.S. dollar is likely to be a beneficiary of this higher-rate environment, which may create a headwind for internationally diversified portfolios. The Fed is expected to keep tighter policy longer than other major central banks.
IMPLICATIONS FOR THE FEDERAL RESERVE
Now to the big question. What does the stalled disinflation trend mean for the Fed? On one hand, the steady annual pace of the Fed’s preferred inflation metric in March helped to assuage concerns that inflation was re-accelerating. However, the strength of the consumer suggests, despite tighter monetary policy, this economy is less interest- rate sensitive than previous cycles, as illustrated by strong residential investment. The Fed is backed into a corner with a strong economy and nagging inflation.
This week’s Fed meeting (May 1–2) will be of particular interest for markets as expectations point to a more “hawkish” stance from policymakers as they underscore the “higher for longer” narrative that interest rates may stay on hold until there’s conclusive evidence that inflation has regained downward momentum. Watch the Fed’s statement and Fed Chair Jerome Powell’s comments closely for clues as to how the central bank views the stalled path to its 2% inflation target and whether the Fed still sees the possibility of initiating an interest rate easing cycle this year.
The needle the Fed is attempting to thread — combatting sticky inflation in a strong economy — isn’t getting any wider. The sticky inflation and steady growth of the economy may delay rate cuts and leave time for only one or possibly two this year (two is now our base case).
STRONG EARNINGS SEASON SO FAR
Earnings season took market-watchers on a ride last week, with big earnings-driven gains in shares of Alphabet (GOOG/L), Microsoft (MSFT), and Tesla (TSLA), alongside a double-digit decline in META after it reported more capital investment than analysts anticipated. The big moves in these stocks got a lot of headlines, and rightly so, but if we look broadly at the earnings numbers, we see good numbers overall. Some highlights with 230 S&P 500 companies having reported:
- A solid 80% of S&P 500 companies have beaten earnings estimates so far this quarter, slightly above historical averages, and 63% have beaten by more than one standard deviation, compared with the historical average of 48%.
- The average upside surprise for earnings is over 8%, a solid number relative to history but in line with the five-year average.
- Big technology companies have more than held their own. Besides TSLA, consensus earnings estimates for all of the so-called “Magnificent Seven” have risen since April 1 — with NVIDIA (NVDA) and Apple (AAPL) yet to report.
- Forward estimates for the index have uncharacteristically risen since reporting season began, by 0.5%. Estimates typically fall 2–3% as companies report, so this result reveals more underlying earnings strength than analysts had anticipated.
SENTIMENT HAS SOURED BUT NOT QUITE A BULLISH CONTRARIAN SIGNAL
Sentiment had been trending at above-average levels of bullishness this entire year. Part of that optimism was driven by expectations for a string of interest rate cuts, but stronger-than-expected economic data and earnings and excitement over artificial intelligence have also contributed.
In recent weeks, however, sentiment began to sour as the market adjusted to the higher-for longer rate backdrop. Many argued a sell-off was overdue as areas of froth were emerging amid overbought market conditions. The S&P 500’s pullback peak to trough from March 28 through April 19 was 5.5%, prior to last week’s rebound.
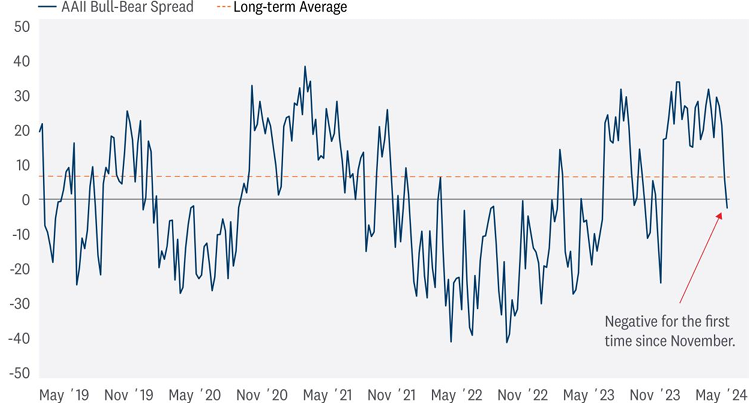
According to the American Association of Individual Investors (AAII) sentiment survey, bearish sentiment among its members recently rose to 34%, snapping 23 weeks of below-average bearish sentiment. At the same time, bullish sentiment fell 6% to only 32% last week, down from over 50% in April. Combining bullish and bearish sentiment provides a more comprehensive view of risk appetite.
As highlighted in the accompanying chart, the bull-bear spread dipped into negative territory for the first time since early November, which means some of the frothy optimism has been wrung out of this market — a good thing for the near-term outlook — but our assessment of these and other sentiment measures do not yet point to a contrarian buy opportunity.
BEARS OUTPACE BULLS FOR THE FIRST TIME SINCE NOVEMBER

Source: LPL Research, American Association of Individual Investors, Bloomberg 04/25/24
Past performance is no guarantee of future results. All indexes are unmanaged and can’t be invested in directly.
LPL Research’s Strategic and Tactical Asset Allocation Committee (STAAC) remains neutral on equities and is inclined to wait for more potential downside before considering adding to equities.
TACTICAL ASSET ALLOCATION INSIGHTS
LPL’s Strategic and Tactical Asset Allocation Committee (STAAC) maintains its neutral equities stance tactically. The improved economic and earnings outlook this year has kept the risk-reward trade-off for stocks and bonds fairly well balanced, perhaps with a slight edge to bonds over stocks currently when looking out to year-end. Recent stubbornly high inflation readings likely delayed Fed rate cuts and may limit the upside to stock prices over the balance of the year, although two cuts may still come by year-end.
Within equities, on a tactical basis, the STAAC continues to favor a tilt toward domestic over international equities, with a preference for Japan among developed markets, and an underweight position in emerging markets (EM).
The Committee recommends a very modest tilt toward the growth style after reducing its overweight position in mid-March. Higher for longer and steady economic growth favors value in the short term, but once the disinflationary trend resumes and rates calm down, look for growth to benefit from its superior earnings power. Communication services and energy remain favored sectors.
Finally, the STAAC continues to recommend a modest overweight to fixed income, funded from cash.
IMPORTANT DISCLOSURES
This material is for general information only and is not intended to provide specific advice or recommendations for any individual. There is no assurance that the views or strategies discussed are suitable for all investors or will yield positive outcomes. Investing involves risks including possible loss of principal. Any economic forecasts set forth may not develop as predicted and are subject to change.
References to markets, asset classes, and sectors are generally regarding the corresponding market index. Indexes are unmanaged statistical composites and cannot be invested into directly. Index performance is not indicative of the performance of any investment and do not reflect fees, expenses, or sales charges. All performance referenced is historical and is no guarantee of future results.
Any company names noted herein are for educational purposes only and not an indication of trading intent or a solicitation of their products or services. LPL Financial doesn’t provide research on individual equities.
All information is believed to be from reliable sources; however, LPL Financial makes no representation as to its completeness or accuracy.
The Standard & Poor’s 500 Index (S&P500) is a capitalization-weighted index of 500 stocks designed to measure performance of the broad domestic economy through changes in the aggregate market value of 500 stocks representing all major industries.
All index data from FactSet.
International investing involves special risks such as currency fluctuation and political instability and may not be suitable for all investors. These risks are often heightened for investments in emerging markets.
LPL Financial does not provide investment banking services and does not engage in initial public offerings or merger and acquisition activities.
The fast price swings of commodities will result in significant volatility in an investor’s holdings.
This research material has been prepared by LPL Financial LLC.
Securities and advisory services offered through LPL Financial (LPL), a registered investment advisor and broker-dealer (member FINRA/SIPC). Insurance products are offered through LPL or its licensed affiliates. To the extent you are receiving investment advice from a separately registered independent investment advisor that is not an LPL affiliate, please note LPL makes no representation with respect to such entity.
Not Insured by FDIC/NCUA or Any Other Government Agency |
Not Bank/Credit Union Deposits or Obligations | Not Bank/Credit Union Guaranteed | May Lose Value
RES-0001000-0324 | For Public Use | Tracking #571281 (Exp. 04/2025)

